How to delta hedge an option: Part IV
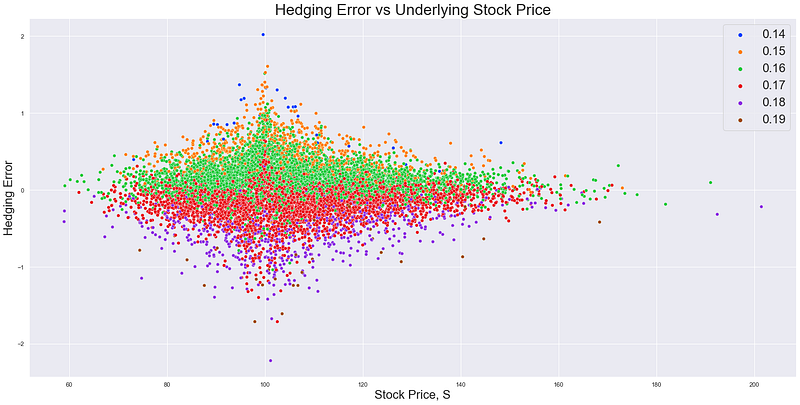
Image by author
We left the previous article having established that miraculously the process of just holding:
- cash
- stocks
and adjusting this quantity of stocks frequently according to what the Black-Scholes delta tells us. Sure, there are lots of assumptions embedded in the way we have set up our simulations but we can start breaking them down later and reveal if the previous conclusions head into the bin with them.
How to delta hedge an option: Part III
medium.datadriveninvestor.com
First, let’s start drilling down into the hedging error we get — why aren’t all our paths exactly equal to the theoretical terminal value?
Hedging error
In order to have a bit of a closer look let’s combine the two graphs. In other words let’s pretend that we sell the call option and go about doing this replication so that at expiry we use our replicating portfolio cash to pay the call option payoff (if there is one — if ITM). By combining the two we can single out the ‘hedging error’ that we experience.

Image by author
Quite a lot to take in here but let’s go step by step. We have 4 graphs in the grid showing scatterplots of the combined value of our short call option and replicating portfolio position — each one showing the combined portfolio with n days left until expiry. I’ve standardised the axes so we can compare easily. What do we see?
- there’s an orange horizontal line stuck on for the mean hedging error and it confirms visual inspection that on average the delta replication is doing its job
- as time passes the underlying stock price spreads out (it has more time to) and this leads to the graphs widening
- as time toward expiry decreases we start to get wider variance of the overall pnl around the strike
K=100
But overall it works. Or put differently, on average it works. Without detracting too much, it works because we’ve built it to work — we’ve set up a simulation under perfect conditions for the Black-Scholes model and then through simulation shown it to be viable. In particular we have:
- simulated stock prices using a known volatility,
sigma, then used that same volatility to compute our deltas to hedge it on (what would happen if we don’t know this or it changes?) - split time into daily increments for hedging — why did we choose this and what happens to the pnl distribution if we change this?
Differing hedging frequencies
Let’s now examine the assumption at the start that we will delta hedge daily — what happens if we were to hedge monthly? Or weekly? Or what about twice per day? Let’s package up the code we have written above so we can deploy it nicely for various time splits.
Now let’s check how our replication performs when we hedge at various time horizons. To do this we will still simulate a stock price over the course of a year, however we will simulate with varying time splits e.g. for daily as per before we will split into 252 increments, for twice daily split into 504 increments and monthly just 12. Just as before then at each time split we will compute our delta, re-hedge as necessary and carry on.

Image by author
So it seems clear (again, because I’ve standardised the axes) that the more frequent our hedging the lower our hedging error vs the theoretical option value. This kind of makes intuitive sense as long as we are using Gaussian returns (much more likely to get small returns than very large ones). This just states that if we chunk our time into smaller and smaller pieces then we are more likely to average in at the actual volatility — because in this case volatility is only defined by when we choose to hedge.
This last bit might need explaining. In theory we could have a stock process with annual log returns with a standard deviation of 16% (as all above simulations have). However in practise if we hedge 12x times i.e. monthly, we may end up with the lucky case where every time we come to hedge the underlying stock price just so happens to be back at S=100. In this example, even though we have daily fluctuations, if we were to calculate the standard deviation of returns based on the 12 times we hedged it would be 0 - because we stay at S=100 and so every return is the same (0%).
This is an extreme example but it holds for the rest — the more frequent our hedging the more likely we are to average into a distribution of stock log returns which reflects the underlying volatility (which we are still assuming we know in advance). If we sell the option based on this volatility (which we do because that’s how we created our starting call option price) then this will lead to lower hedging error in our replicating portfolio.
Is there a relationship between hedging frequency and standard deviation of pnl?
In other words is there a tighter mathematical relationship we can draw between the two rather than just the vague “hedging more frequently reduces pnl volatility’. It turns out in the world we have constructed above (Gaussian returns etc) there is. The proof is a bit too mathsy for here but there’s a cracking explanation of it in the start of Bergomi’s famous book Stochastic Volatility Modelling. It turns out that our hedging error should decrease with the square root of the frequency of our hedges i.e. hedging 4x as often should knock our hedging error in half.
Let’s try it out — we’ll do the same as the above but for a few more hedging time horizons and plot the associated standard deviation of the hedging error.
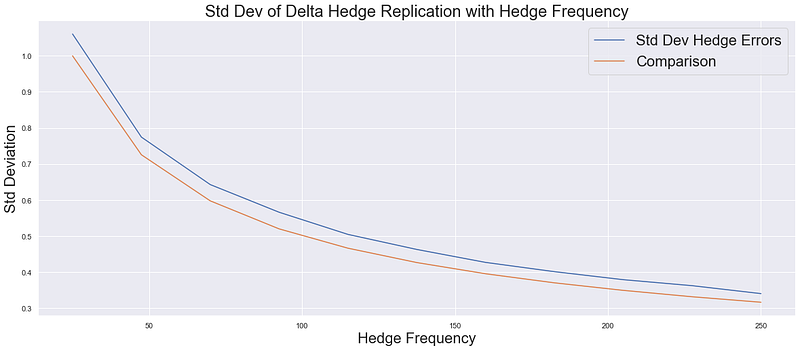
Image by author
So it seems to check out — increasing your hedge frequency will decrease your hedging errors, but you will head into greater and greater diminishing returns.
Why do we make money on some paths and lose on others?
This is something we just glossed over in the above. We accepted quite blindly that on average delta hedging worked (in our idealised world) because our average hedging error was basically zero. We didn’t question why it is that on some paths we end up making money and on some paths we end up losing money. Now let’s have a look a this — is there some way we can understand why some paths produced positive hedging error whereas other paths cost us?
Back to volatility
In the previous article we established the following: that buying options and delta hedging them can be viewed as ‘buying volatility’ (more accurately variance) because we will make more money from rebalancing our delta hedge over and over if the stock price moves around more. This is because we will likely have larger gaps in the prices which we buy (low) at and sell (high) at. We are also likely to have larger changes in our delta so we will be capitalising on this price differential in bigger quantities of stocks.
So can we use this logic to partition out our paths? Is it the case that on the paths where the realised volatility was higher i.e. the actual realised stock log returns on that path were higher than our input 16%, we lost money and vice versa? (We would lose money if volatility is higher here because in our example we are assuming that we sold the call option). To do this let’s define how we compute realised volatility then see if we can use this number to group our paths.
Realised Volatility
To compute the realised volatility we do the following with the log returns:
- square and then sum them
- annualise them
- take the square root
Mathematically this looks like the following for the realised volatility, rv:
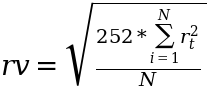
Image by author
With that in mind we can now compute the realised volatility per path, bin our 10,000 simulations into groups and use those groups as a hue overlaying our graph of replication hedging errors. To note - the reason we have variance in our volatility is that each path could be viewed as a ‘sample’ and so the sample standard deviation will have a distribution around the ‘population’ parameter we input.
Image by author
Pretty. Now we can see quite clearly that the paths that experienced higher volatility than our delta was hedged on (16%) were more likely to cause negative replication errors, and those with lower volatility positive ones. In reality it is not exactly the realised volatility we are exposed to but more the ‘gamma weighted’ realised volatility. In simple terms, we don’t care if there is a very volatile move if our delta doesn’t change because that means we don’t need to buy/sell any stock on the back of it.
When we sell options this constant re-hedging behaviour costs us (called ‘short gamma’) but if we have very little gamma then the size of the move doesn’t matter to us — big or small. So really we should be looking at some kind of weighting scheme on the returns where we apply larger weights to the moves we experience with a lot of gamma compared to the moves we experience with only a little gamma; rather than the standard deviation calculation which is just a straight average (every squared move gets the same weight).
Conclusions
So we’ve now gone one step deeper to understand exactly how delta hedging works by using simulations to add some colour to the logic previously discussed. We still haven’t touched on many topics — most notably if the above distribution of hedging errors is acceptable. It might be all well and good that we average zero hedging errors, but unless we execute thousands and thousands of trades we may not achieve this average.
How big is the standard deviation of hedging errors versus what is normally charged by trading desks to manage these positions? This is obviously variable but to take a simple example we might charge ‘0.5 vol’ to risk manage the above i.e. to sell the above call option and delta hedge it to achieve a replication.
In the case of the above T=1, K=100 option this would amount to us charging 0.2 because the ‘vega’ (sensitivity to implied vol) is around 0.4. As the above chart shows this is almost nothing in comparison to the realised hedging errors we would expect if all we did was delta hedge the position - back to the expression at the end of the last article: ‘options hedge options’.
Next let’s have a look at what happens if we use the ‘wrong’ volatility to compute our delta hedges on. In other words, if we simulate stock log returns with a known volatility but compute our delta with a volatility that differs from this — how does our pnl distribution look?
How to delta hedge an option: Part V
medium.datadriveninvestor.com
Schedule a DDIChat Session in Hedge Fund and Trading Strategy:
Experts - Hedge Fund and Trading Strategy - DDIChat
_DDIChat allows individuals and businesses to speak directly with subject matter experts. It makes consultation fast…_app.ddichat.com